
I am going to touch on various topics regarding the markets and economy.
You can jump to those sections here:
Why is the economy still positive and inflation not subsiding faster?
Where will interest rates go long term?
What is next for the residential housing market?
Economic slowdown and investment risk
How should you position your portfolio to weather an economic downturn?
Recent market action
The stock market, as a whole, has had a great couple of months. The last two weeks of July put an exclamation point on that. Prior to June, it had been a tale of have and have nots. Then things shifted at the beginning of June, from a very narrow market advance to a much broader one. The market has slowed down to start August which may be the start of a correction to digest recent gains. We are also in a seasonally challenging period of the year.
The S&P 500 (the one we see – weighted by size of company or capitalization) was up +9.68% through the end of May versus the S&P 500 Equal Weighted (each stock is equally weighted despite company size, i.e. 1/500) which was down -0.67% for the same time period.. The reason for this discrepancy is that the capitalization weighted index is dominated by the large high tech companies such as Apple, Google, Microsoft, etc. Those were a few of the handful of high performing stocks this year. Gains in this sector were helped in part by a bounce back from the large losses sustained last year and the scuttlebut over AI.
Last year playing defense was the right call and played out well. The beginning of this year looked the same except for technology (or literally a handful of tech stocks) that carried the water for the market. The lack of broad market momentum and continued economic weakness (other than job growth) was a concern.
The market now appears to be pricing in an expected slowing of Federal Reserve rate increases and a soft economic landing. As I have been noting since last year, this action may just be responsible for the recent market rally. While the excitement may not last, we might as well take advantage of it for now.
A silver lining to the high inflation and increased interest rates is that short term Treasuries are currently at approximately 5.50% for one to six months, while 10 year bonds are at 4+% (inverted yield curve, see the Economic slowdown and investment risk section below). In addition, brokerage firm money market rates are now over 5%.
The pandemic further broke an already volatile broken market. The beauty on the upswing of the market has been that algorithmic computer trading has helped the upside momentum, but the algorithm bringith up and down. Please read through to the last section of this article How should you position your portfolio to weather an economic downturn for strategies to make sure your portfolio is ready for all types of markets.
Why is the economy still positive and inflation not subsiding faster?
Jobs growth has been the bright spot of the economic numbers, but it may not be sustainable. The problem is that government jobs are leading the growth, that is not good. We need the private sector, which pays the bills, to be leading. Private sector job growth always translates into stronger economic growth.
What is driving the economy appears to be the leftover government stimulus. The remaining stimulus, ($500 billion left at the end of March 2023 from the $1.9 trillion American Rescue Plan). This stimulus money is expected to continue to be spent in the economy through at least the end of the year. This is not helping the fight against inflation. Currently the federal government is fighting the Federal Reserve’s policies to slow spending and economic growth and therefore inflation.
With the growth in stimulus and government jobs, the wrong sector is leading. This is unsustainable. The only way this can continue is further government debt and/or higher taxes. Both are killers of an economy.
After the government stimulus money dries up the economy could dip into a recession.
What will be the catalyst for future growth when the government stimulus dries up?
- Not productivity gains -productivity has continued to fall,
- Not tax cuts – none are anticipated (if done properly can spur growth),
- Not low debt burdens – personal, corporate and government debt are at historic highs and continue to grow (low debt supports higher economic investment and spending).
- This debt is what has fueled the growth over the last multiple years. Soon it will be time to pay the piper.
Government debt and spending is suffocating the economy. Budget deficits are beyond what we could have comprehended before the pandemic. This government spending is fueling inflation. We are going against the historic game plan, government spending is needed when in a recession to stimulate the economy. We will have no bullets left when/if we enter a recession.
Where will interest rates go long term?
This is anyone’s guess. We may be in a higher rate environment for a while. OakTree Investments’ Performing Credit Quarterly second quarter update “Fighting the Fed”, suggests that interest rates will not subside due to issuance of more Treasury debt and deglobalization. (Globalization reduced inflation and interest rates, the opposite will be true with deglobalization).
OakTree sees this “higher interest rate regime” creating problems in the credit markets with increased defaults.
The yield curve is flattening a bit. Long term rates have inched up – now over 4% for 10-year US Treasury bonds. With Japan’s recent signal that they will allow their 10-year bond rate to rise, this will put pressure on the US 10-year bond to continue to rise. What will stop this increase in rates is the sign of a recession. That sign may already be here as the interest rate on the 10-year US Treasury bond is already signaling a slowing economy. The rate should be higher in comparison to short term rates and other factors.
What is next for the residential housing market?
This is one of the most common questions I am asked. I too am very curious about the direction of the residential housing market.
So higher interest rates will decrease residential real estate prices and make them more affordable, right?
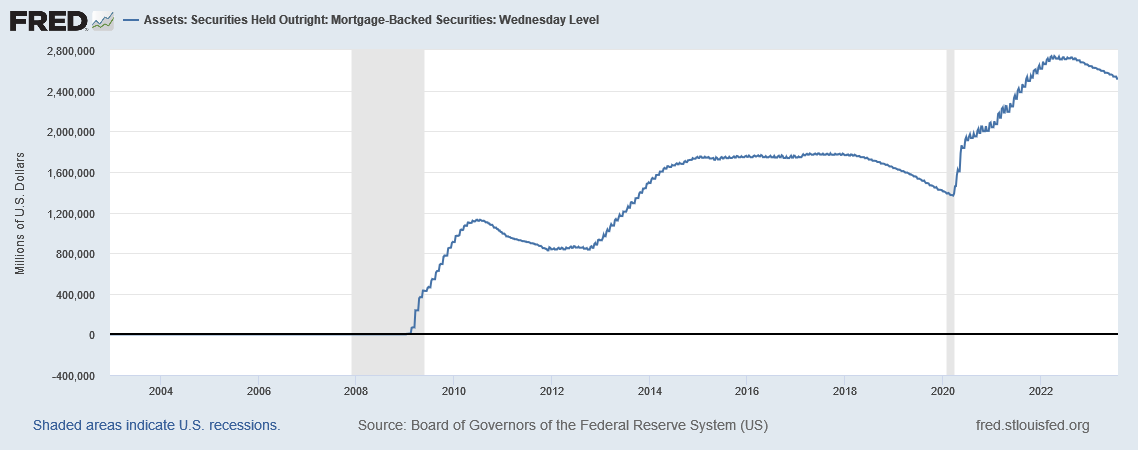
Yes, usually but there is a lag. This time there appears to be a longer lag due to the Federal Reserve keeping interest rates so low for so long and creating a bubble in the real estate and stock markets. The Federal Reserve owning and back-stopping Mortgage Backed Securities is also propping up the market.
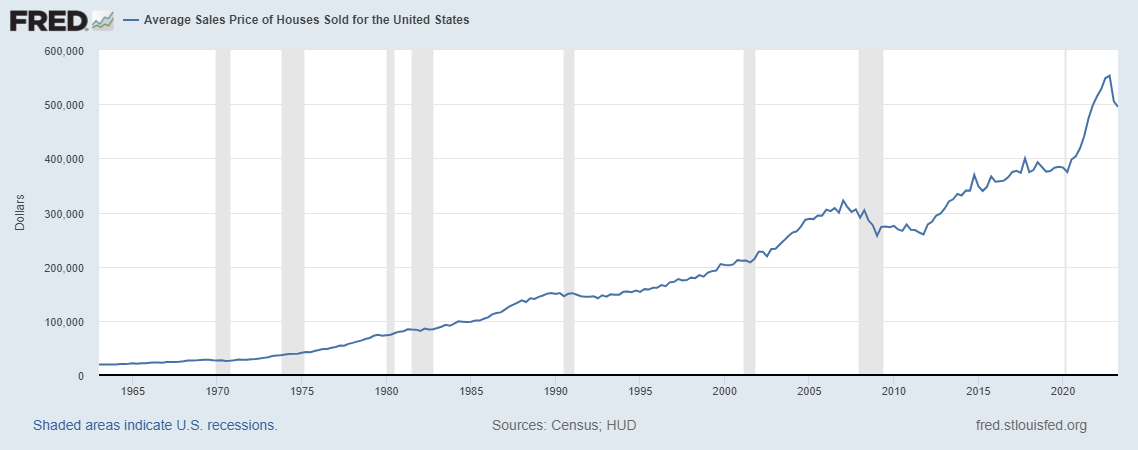
The residential real estate bubble – correlated with Fed induced artificially low interest rates
Mortgage Backed Securities held outright by the US government – 0% until 2009
Obviously lower prices would be welcomed by many trying to enter the market, where house prices have become beyond the reach of many. The cost of housing as a percentage of gross income has increased significantly. This Business Insider article from last year notes that mortgage debt service, as a percentage of income, is the highest since 2007.
However, that may not correlate into lower prices as it has in previous economic cycles. Demand is still high due to very low inventory. One of the reasons is the higher interest rates .
There have been many articles about the lack of building enough new homes after the mortgage crisis and Great Recession. However, if that is an issue, it is not the only issue. Corporate investors/flippers and Airbnb, VRBO, etc have increased prices, especially in resort areas. Airbnb has also had an impact in residential neighborhoods by reducing homes available for owner occupants or renters.
The chart above shows that the spike in home prices is unsustainable. It is impossible to know how this unravels but an economic slowdown which puts sellers in distress will go a long way to bringing prices down.
For the residential housing market, a very bright Millennial Amy Nixon is a good follow on Twitter. She analyzes the macroeconomics of the real estate market. She has some great insights, including her involvement in the viral Airbnbust storyline.
Amy, I, and others hope that the Federal Reserve gets out of the forever low interest rate business. This wish may never come true. The Federal Reserve has broken the residential housing market with the forever low interest rates and backing the mortgage market. Let the market do its thing so younger and lower income earners can afford a house. Since the turn of the century and Alan Greenspan, the Federal Reserve’s policy has been to backstop the real estate and financial markets. Mommy, please make them stop so our kids are not subjected to forever bubbles and bursts.
If you have the money saved for a house, a stable job and intend on staying in the area then you can buy a home in any market. You may overpay, but if history is a guide (you never know how the future will play out), you can stay in the house until prices rebound after a down market.
Elevated Corporate profits
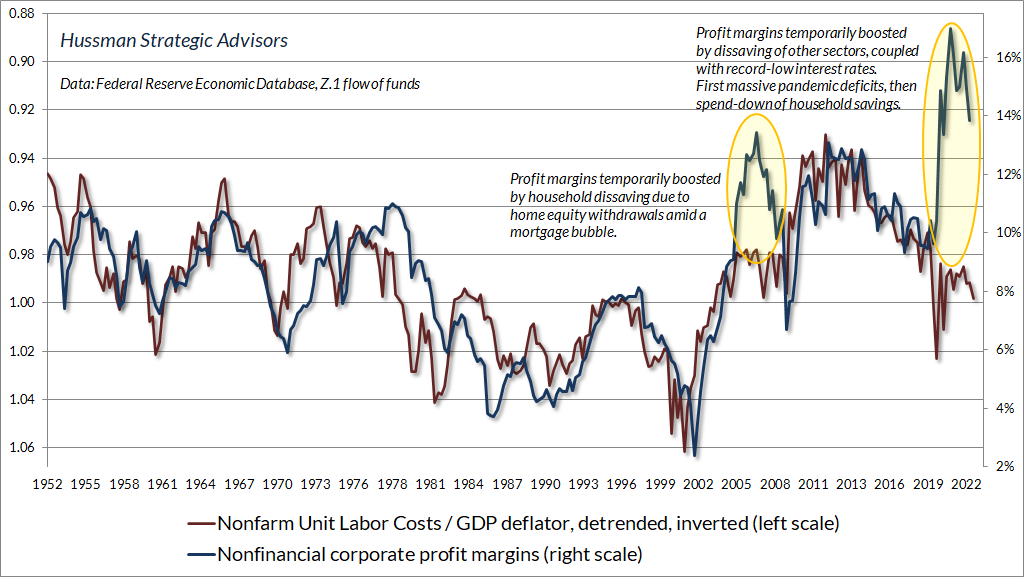
A couple of the brightest stock market/economic minds, John Hussman and James Montier, recently wrote about the current highly elevated corporate profits. High corporate profits elevate the value of stocks.
John Hussman Ph.D., as always puts the math behind it. In his recent commentary Money, Banking, and Markets – Connecting the Dots he included the graph below. He shows how historically unit labor costs/GDP deflator is highly correlated to corporate profits. The graph shows how the correlation between the two is completely out of whack. Corporate profits are WAY above trend. This has to revert to the mean.
James Montier of GMO Investments also wrote in May of this year about elevated corporate profit margins in his white paper The Curious Incident of the Elevated Profit Margins . He notes how profit margins have remained elevated for over a decade. He notes that the Robert Shiller of Yale Price/Earnings (PE) ratio includes these elevated valuations and is still high at 30x (average 16). We use GMO’s 7-Year Asset Class Forecast (market valuations) and the Nobel prize winning Robert Shiller’s work in our Market Value update.
Both Hussman and GMO Investments note that excess government deficits are funding the elevated corporate profits and higher stock valuations. The ledger must balance (“accounting identity” per Hussman) and it has been coming down to consumers and their higher spending and government deficits to create this balance. This higher spending is driving higher corporate profits and stock prices.
The good news as James Montier notes is that foreign stock valuations are far better.
Economic slowdown and investment risk
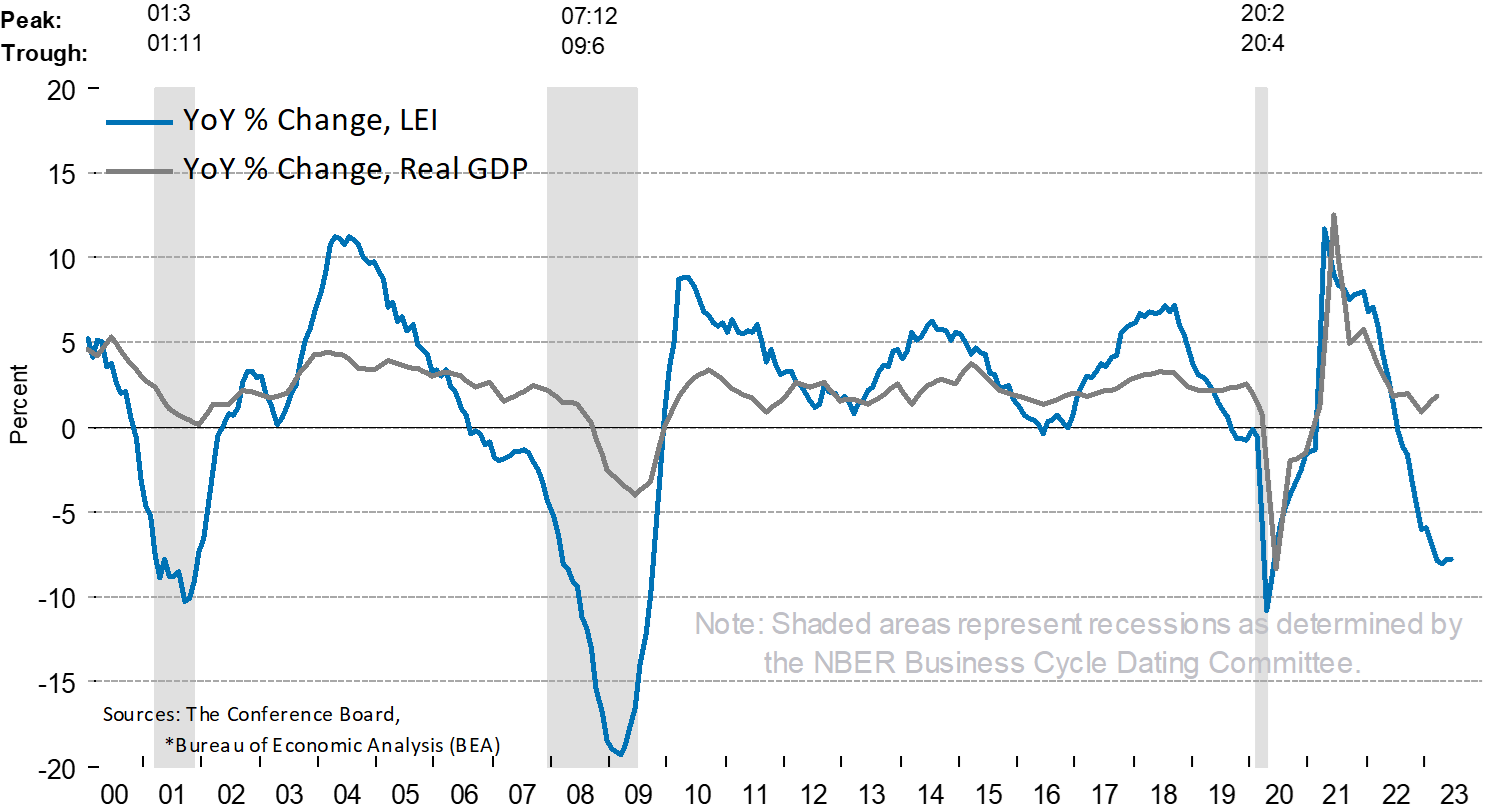
The Eurozone is in recession. The recent 2% growth of the US economy is not high growth. Prior recessions have been preceded by similar growth. The issue is while we are seeing positive growth numbers the Leading Economic Indicators (LEI) are plummeting. This has happened before prior recessions.
The Leading Economic Indicators (LEI) index has fallen for 15 consecutive months. The fall has been steep and wide ranging, the dreaded three D’s; Depth, Dispersion and Durationwhich usually portends a recession. We are still within the lag time between negative LEI and an inverted yield curve before a recession hits.
Leading Economic Indicators (LEI) falling off a cliff
Before every recession the Federal Reserve and Wall Street always predict a soft landing or, as Ben Bernanke famously noted in August of 2008, a “mild recession”. Six months prior, In February of 2008, Mr. Bernanke and the Federal Reserve thought we would not see a recession and the economy would pick up in the second half of the year. Their forecasts are always unreliable.
Keep an eye on the stock market. The market generally turns down six months before a recession.
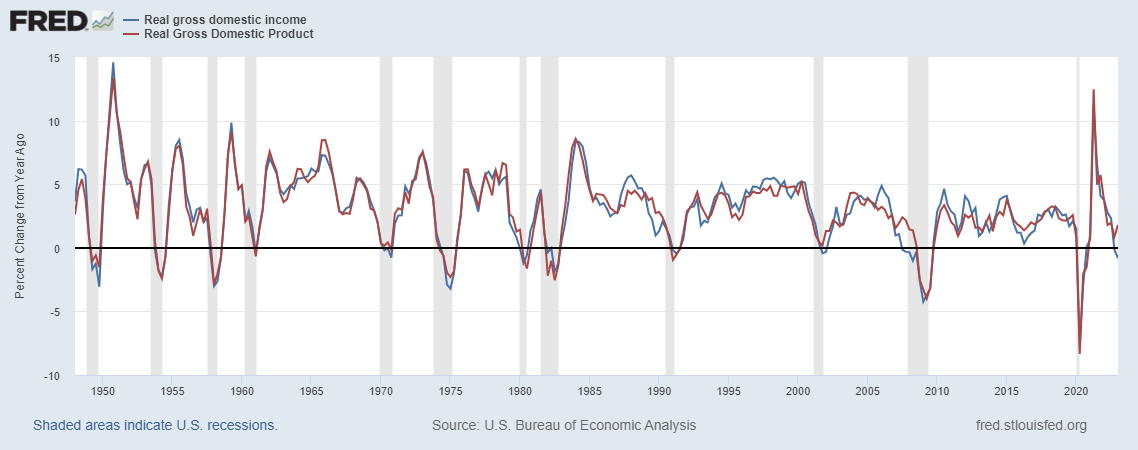
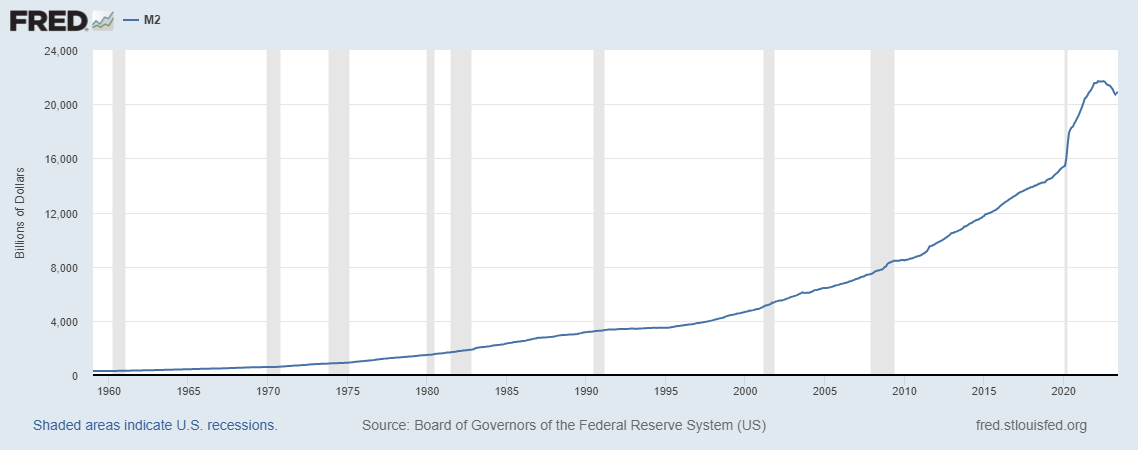
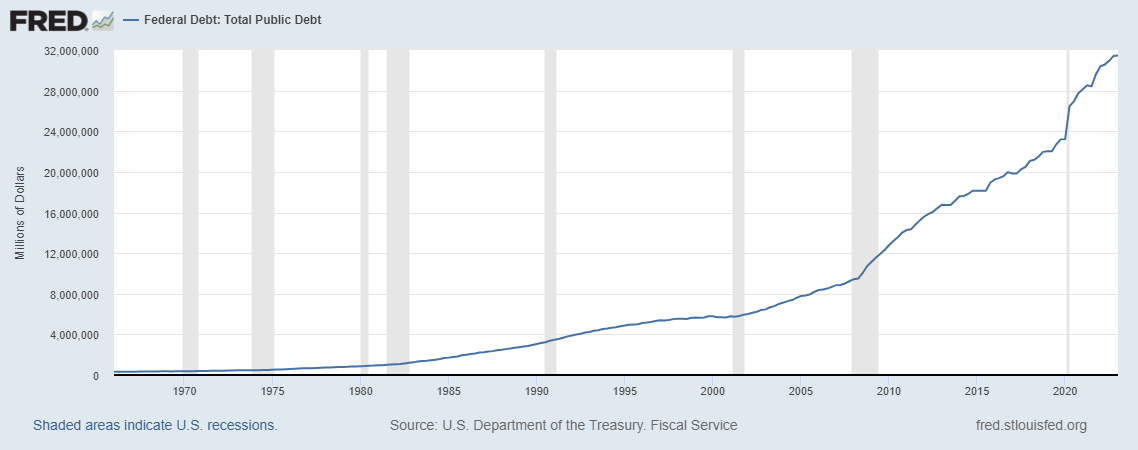
Here are some FRED (Federal Reserve Economic Data) charts. None of which paint a pretty picture of sustainable economic growth:
Gross Domestic Income (GDI) and Gross Domestic Product (GDP) usually move together. As you can see from the chart below, GDI is showing recession but the revised GDP number turned up. We will have to wait for this to work itself out. It is not encouraging that GDI has fallen to a recession level.“Real” (or inflation adjusted) GDI measures what the economy makes on wages, profits and taxes. It does make sense that, when adjusted for inflation, income is low, in the recessionary range.
Real Gross Domestic Income (GDI) and Product (GDP) – GDI is negative
The Money Supply is shrinking which is recessionary
Total Public Debt continues to grow and spiral out of control. This will continue to slow growth. Why? – because money paid toward debt or spending in a prior period is not money that can be spent on goods, services or investment now. We had a party (or the politicians did) and our kids and grandkids will have to pay for it, ughhh.
Total Public Debt – over $30 Trillion – please make them stop!
A sane voice, Lacy Hunt, the seasoned and brilliant economist and his firm Hoisington Investment Management, has been warning about the slowing economy the last several quarters. In Hoisington’s latest Quarterly Review and Outlook, they note that real bank credit has been negative over the last three years! Historically, real bank credit is a positive 3.4% per year. The contraction in Real Bank Credit while GDP is rising is unprecedented. Usually real bank credit does not turn negative until the economy is already in recession. Sometimes real bank credit doesn’t go negative even during a recession. Obviously, this is not a good sign.
What is the investment risk ahead?
High based on overvaluation and slowing economic growth. Below is a graph from John Hussman’s July market commentary Air Pockets, Free Falls, and More Cowbell . The graph shows how elevated stock market prices are. They will revert to the mean, or the average growth rate over multiple decades.
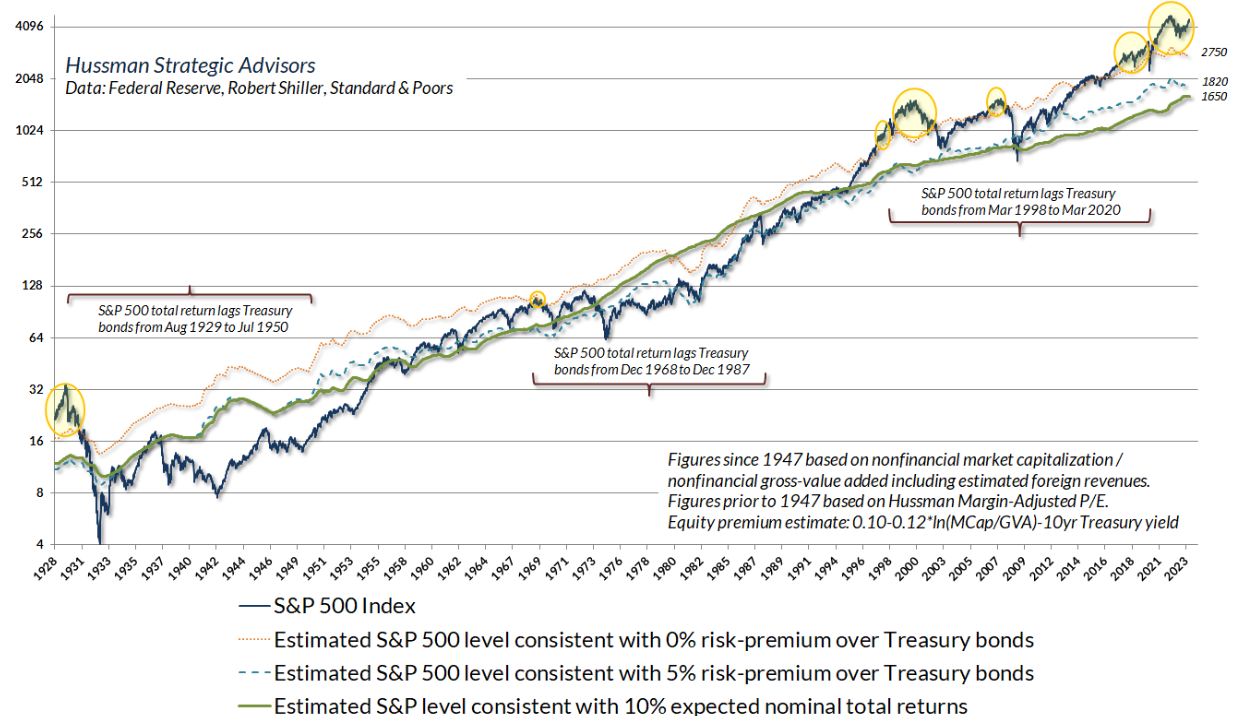
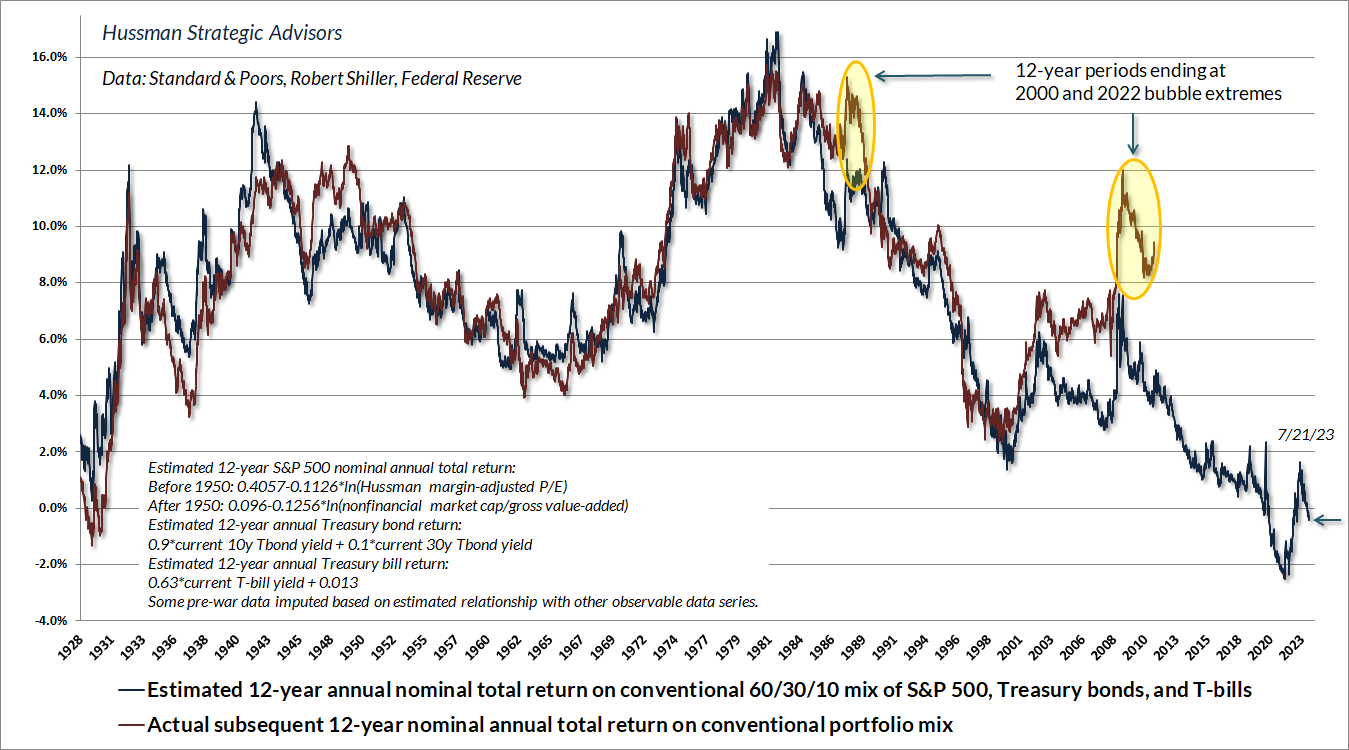
Another graph from Hussman’s July market commentary shows that the “Policy Portfolio” of 60% in stocks and 30% in bonds and 10% in cash is projected to provide no return over the next 10 years due to the overvaluation of both stocks and bonds.
How should you position your portfolio to weather an economic downturn?
This Wall Street Journal article Boomers Got Hooked on Stocks. Now They Can’t Let Go (which is behind a paywall so I will summarize) noted how those aged 65 and older have an allocation to stocks in their portfolios (60+%), close to younger investors. This would be fine in a fairly valued or undervalued market but could be problematic based on the current market valuation.
GMO recently wrote about the current risk of a financial crisis due to a build up of private sector debt, which has been historically high for 20 years. James Montier recommends some strategies for insulating your portfolio for the inevitable market drawdown. We recommend the same in our recent Market Valuation update. If you are a passive buy-and-hold investor, make sure you align your risk with what you can afford to lose in a bear market, when the stock market losses can average over 40%. (The losses were over 50% in the last two significant bear markets in 2020-2003 and 2007-2009.).
For most investors who take a passive approach, review your exposure to risky investments, i.e. stocks, junkier bonds etc. Multiply the amount of risk in your portfolio (e.g. 60%) times the average bear market loss of 50% to arrive at your exposure (sample exposure = 30%). The result is the potential loss in your portfolio (We will assume that where bond values are lousy, they will not cushion the blow that much). Now multiply that loss (in my example 30%) times the value of your portfolio. For a million dollar portfolio that is a potential loss of $300,000. Is that something you can’t stomach? Is that something that will impact your goals (e.g. retiring or sending your kids to college in x years)? If the answer to either of the above questions is “Yes” then reduce your exposure to risk. Cash (brokerage money market accounts) are paying 5% or close to it. Cash is not a bad investment diversifier in this higher short term interest rate environment.
Bartley Financial is built around a client-first ethos. We are as committed to exhibiting high levels of professionalism as we are to building relationships with clients built on trust and mutual respect. That’s why we hold ourselves to a fiduciary standard. It’s also why we offer a transparent, fee-only compensation structure so that our clients never need to be concerned about a conflict of interest.
Bartley Financial has an experienced team of CPAs and CFPs® (Certified Financial Planners®) dedicated to helping clients manage their investment portfolios, plan for retirement, strategize taxes, or execute any other initiatives in pursuit of optimum financial health and minimal financial stress. From our offices in Andover, MA, and Bedford, NH, we work to ease clients’ financial concerns, strengthen their portfolios, and assuage their worry that they don’t know what they don’t know.
Contact us today to begin a relationship with a team of knowledgeable, trustworthy professionals who put their clients first.